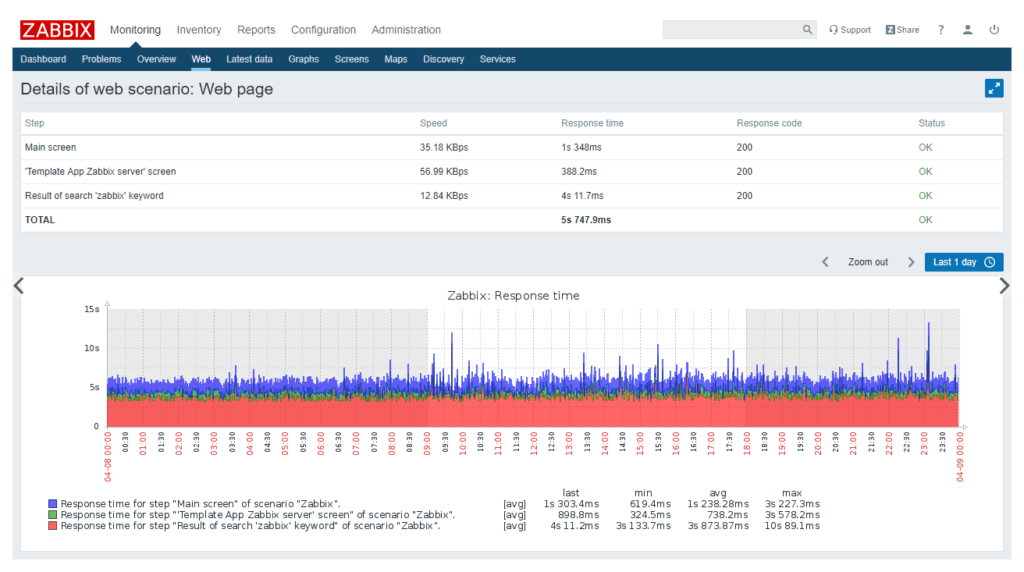
An indispensable tool for keeping complex infrastructure controlled is a monitoring system. Secure Online Desktop (SOD) Web Console does just that: it offers the tools to control a network of machines and devices to verify its efficiency. Web Console is based on Zabbix, a scalable Open Source platform with huge capabilities.
Among the advantages of the SOD Web Console, there are the possibility of using agent less under some circumstances the great possibility of customization. The platform offered allows scripting in various languages, including Python, Perl or directly in the shell, just to give examples.
Monitoring with Web Console and Zabbix
To collect data from the infrastructure, it is necessary to install so-called software agents for the machines to be monitored. These software use native processes and free from the need to have dedicated environments such as Java or .Net.
The data collected by the agents are sent to a server that collects all the metrics and provides them to the console. From here it is then possible to analyze them, manipulate them and set triggers of notifications or automations useful for management.
When communicating between the components of the Zabbix monitoring system, only authorized IPs are accepted. Since the other connections are not accepted, security is guaranteed during data transfers between the software.
Web Console functionality
Every aspect of the infrastructure can be monitored through the Web Console offered by SOD. Even if it is not possible to install additional software, there is a limited control action without agents installed. This solution allows you to collect metrics on the responsiveness and availability of standard services, such as mail or web servers.
Scalability of data collection
The Zabbix system offered by the SOD Web Console is able to recover data and metrics from any device or software. Through the use of different control protocols, the available software agents are able to collect any type of data.
Monitoring supported
Through the Zabbix agents used, the data collected is complete and includes both hardware and software metrics.
For example, metrics from infrastructure network hardware are collected by SNMP agents. An optimal solution for network capacity management and planning. The measurements include the use of memory, CPU, RAM and the status of the logical ports of the controlled peripherals.
The controls include more levels of system complexity. Agents can collect information from:
– Hardware (CPU, fans, storage media, etc.)
– Network (ports used, memory usage, etc.)
– Operating systems (Unix, Windows, MacOs, etc.)
– Middleware software (Oracle, MySql, Apache, etc.)
– Web applications
– Cloud resources
Monitoring web services
The built-in system for monitoring web services is worthy of specific mention.
Through the use of this function, it is possible to define the sequential steps to be performed for the analysis of a website. It is possible to monitor the site response speed and downloads, for example. But also availability, as well as data relating to e-commerce portals and other web based applications.
Scalability ‘
SOD Web Console is scalable and adaptable to the size of the infrastructure. From the small corporate IT network, to even very complex solutions from thousands of machines and devices. A single installation can support up to 3,000,000 checks per minute, collecting gigabytes of data per day.
Furthermore, through the use of proxy software components, it is possible to distribute the data collection and decentralize the calculation operations. In this way the control of ports and connections is more easily managed.
You can organize your network into sections where metrics are collected and calculated independently. The proxy in charge of the calculation will be the only connection outgoing from the subsystem.
Notifications and triggers
An efficient monitoring strategy provides not only the collection of data, but also a system for which any anomaly is reported in order to be able to intervene promptly.
The SOD Web Console implements a customizable system of triggers and notifications to be always informed in case something is not going as it should.
Ideally, once the first data is collected, the thresholds of values considered “normal” are established. On the basis of these, a notification system is customized which immediately communicates the exceeding of a safety threshold of certain parameters.
The management of metrics is thus very lightened by an automatic verification of their values. When a parameter presents an anomalous value, one would be immediately informed.
The notification methods supported are: email, SMS, Jabber or through other methods customizable through scripting.
How to request and install Web Console
It is possible to request SOD Web Console after a first initial meeting with our network architect. On that occasion, the computer perimeters of the network to be monitored and what the alarm notification modes are defined.
After this first step, our team will take care of installing all the software needed to collect metrics on the systems involved. Once these operations are completed, the system will be ready and accessible from a console in the cloud. The access data are provided only after the installation of the entire control system.
From the Web Console you will be able to check all monitored metrics, check performance and manage notifications.
Download the brochure or try a demo of the Web Console.
[btnsx id=”2931″]
Useful links:
How to have your computer network under control
Once you set up an IT development and management environment, it can be difficult to keep everything under control. IT monitoring systems come in handy, specifically designed to keep the entire system monitored.
The monitoring system of an ICT infrastructure allows you to report any anomalies that may occur within the components of the IT network. In this world, it is easy to predict and resolve problems before they can cause a service outage.
Monitoring system in practice
In the practice of an IT operator, the monitoring system is the equivalent of a dashboard for a motorist.
Modern cars have sensors and controls for every measurable value in the car. Thanks to a sensor system and a central computer for signal management, any failure or malfunction is signaled immediately. When a certain warning light comes on, or the sound of a certain buzzer sounds, the driver knows that something is not working as it should. In this way serious problems can also be avoided.
A monitoring system works with the same intentions. A set of software components, installed on the various machines connected together in the infrastructure, controls the correct operation by measuring certain parameters. The result is that a system collapses and stops functioning due to malfunctions that have gone unnoticed.
How an IT monitoring system works
Perche’ il sistema di monitoraggio funzioni correttamente, e’ necessario installare sulle macchine dei software agent. Queste applicazioni, disponibili per ogni tipo di sistema operativo, tengono sotto controllo i parametri della macchine e inviano le informazioni a un software che e’ preposto per la raccolta. Questo, chiamato server, dopo la raccolta dei dati inviati dagli agenti, mostra i risultati dei rilevamenti attraverso della grafica per renderli facili da consultare.
I componenti del sistema di monitoraggio comunicano tra di loro in modo sicuro. Nel sistema offerto dalla Secure Online Desktop (SOD), Zabbix, questo avviene accettando solo connessioni da IP autorizzati. Con il sistema di monitoring di SOD, inoltre, e’ possibile anche un controllo agent-less, cioe’ senza il bisogno di installare alcun software agent sulle macchine controllate.
Perche’ monitorare?
La risposta semplice alla domanda e’: per prevenire interruzioni di servizio e danni fisici alle macchine fisiche, seppur queste potrebbero essere di competenza esclusiva del provider. La salute delle architetture IT utilizzate per fornire un servizio ai clienti, e’ importante quanto il servizio stesso.
Il segreto e’ avere tutte le risorse sotto controllo. Questo include l’hardware cosi’ come il software utilizzato.
In particolare e’ bene tenere a mente che molti fattori entrano in gioco quando parliamo di efficienza di un sistema. Per esempio il carico di lavoro di un server, i suoi tempi di risposta e le performance dei database coinvolti possono influenzare l’esperienza dell’utente finale.
Strategia d’uso di un sistema di IT monitoring
After installing the software needed to collect and process data on the machines involved, it is time to prepare a solid system control strategy.
The steps are not many, but all fundamental for maintaining the effectiveness of the control high.
1) Data collection
In the first step it is necessary to verify that the data are: available, collected and usable for subsequent analysis.
Obviously, the first thing to do is to collect data. If you don’t have the data, it can’t be analyzed. Make sure that the data collected is usable and relevant to achieving your goals.
2) Identification of the parameters
In the second step, thanks to a first analysis of the systems, the “normal” performances are identified for the machines and applications involved.
By setting the monitoring on the application performance level for each metric, you can compare the performance of the infrastructure in real time, having a basis of comparison to identify possible anomalies.
3) Alarm levels
The time has come to identify what the parameter alarm levels are and consequently which thresholds to set before receiving a malfunction warning. The approach is possible in two ways: it is based on generic statistical thresholds or on the deviation of the basic services analyzed in step 2.
It is not easy to decide which approach to use. To avoid triggering a disproportionate number of warnings, you should be able to specify what the acceptable deviation is for each metric.
4) Data analysis
Finally, the data must be analyzed to verify that the decisions made in the previous steps are always valid and that the systems are operating efficiently.
A proactive analysis is essential to always keep the architectures involved in order. This ensures that future problems that can negatively impact customer services are avoided.
Conclusions
An efficient and well-structured monitoring system is an indispensable prerogative for IT infrastructures.
On the market there are various possibilities to implement this service to your system. SOD offers a web control console through Zabbix, an enterprise solution for system monitoring.
Give yourself the advantage of improving the quality of your services without sacrificing operating costs.
[btnsx id=”2931″]
Useful links:
How to have your computer network under control
monitoring
In recent years we have witnessed a rapid evolution of information infrastructures that have become increasingly complex and heterogeneous. The introduction of virtualization, thanks to the economic savings and its simplicity, has encouraged the increase in the number of servers divided then by functions and roles. Technologies like the Cloud have allowed to extend the company boundaries, just think of the hybrid Cloud or the public Cloud where previously physical servers that were physically present in the company have evolved in virtual instances in executions on more Datacenter also geographically distributed on the globe. Last but not least, the IoT (Internet of Things) has contributed to enrich the network of devices on the network and that it is necessary to manage.
The age of check-lists
Not many years ago, the system operators had sufficient check-lists, regularly performed according to work procedures, to monitor the company server pool and thus ensure the correct functioning of all the IT components, with particular attention to the business critical systems. Today this approach, as well as expensive, would be ineffective, mainly because of how the company infrastructure has evolved. The manual controls would become not only numerous but also unmanageable and with an inherently high degree of error. Moreover, in this scenario, it is not possible to guarantee a correct timeliness in the identification of a problem or in the management of a breakdown.
Automated monitoring
The evolution of the IT model has introduced the need to introduce new ways of controlling the network that are automated or semi-automated, distributed and above all pro-active / reactive. In fact, solutions have been developed capable of managing an increasingly high, heterogeneous and distributed number of network devices. The new monitoring systems are also able to set the frequency of the measurements based on the metrics observed, increasing it for those values in continuous change that it is necessary to observe therefore continuously and decreasing it for the more static ones. For example, disk space occupation in some environments may vary less than the network bandwidth. This precaution allows to optimize the resources of the monitoring avoiding to measure continuously less dynamic variables.
The evolutions of these monitoring systems have also made it possible to collect data centrally with the possibility of comparing different metrics to each other thus obtaining the composed metrics. Not merely measuring a single metric but comparing its value in relation to another (even different systems) has extended the concept of monitoring.
Item and Trigger
In the systems world or systems monitoring applications there are two basic concepts such as Item and Trigger. The first, Item, represent the metrics or the value (numeric, Boolean, textual) measured or to be measured (eg cluster status, CPU usage, disk usage, etc) while the seconds, Triggers, are the thresholds that you want to apply to a certain Item to check its value. For example, you may need to set two Triggers to monitor the volume occupation of a SAN by receiving a first notification if this exceeds 80% of the maximum capacity and a second in the case of 90%. This modular feature (Item and Trigger) allows for example to simply monitor the trend of a given metric (eg data center band) without necessarily applying a triggger to the measurement or allows to apply more thresholds to the same item to monitor the change in value reporting the change with different actions based on the triggers.
Actions
Upon the occurrence of a certain condition identified by the triggers, it is possible to perform a specific action such as sending an email, a text message, a VoIP call or running a program. For example, you could monitor a log file (item log file equal to catalina.log) and upon the occurrence of a certain condition (trigger that verifies the presence of a certain pattern) restart the relative application. In addition to being automated, actions can also be manual, leaving the monitoring system operator the possibility to apply them when it is deemed most appropriate.
Solution for monitoring the IT infrastructure
The Secure Online Desktop provides its customers with two monitoring services:
◊ IT monitoring service: This service is a complete solution for monitoring the customer’s IT infrastructure without needing to install additional hardware. The solution involves the use of a Cloud management console and a set of specific software agents that our staff will install.
◊ Managed monitoring service: This service is an add-on to the Cloud Server service that plans to monitor the Cloud servers that the customer buys.
[btnsx id=”2931″]
Useful links:
Customers
Twitter FEED
Recent activity
-
SecureOnlineDesktop
Estimated reading time: 6 minutes L'impatto crescente delle minacce informatiche, su sistemi operativi privati op… https://t.co/FimxTS4o9G
-
SecureOnlineDesktop
Estimated reading time: 6 minutes The growing impact of cyber threats, on private or corporate operating systems… https://t.co/y6G6RYA9n1
-
SecureOnlineDesktop
Tempo di lettura stimato: 6 minuti Today we are talking about the CTI update of our services. Data security is… https://t.co/YAZkn7iFqa
-
SecureOnlineDesktop
Estimated reading time: 6 minutes Il tema della sicurezza delle informazioni è di grande attualità in questo peri… https://t.co/tfve5Kzr09
-
SecureOnlineDesktop
Estimated reading time: 6 minutes The issue of information security is very topical in this historical period ch… https://t.co/TP8gvdRcrF
Newsletter
{subscription_form_1}© 2024 Cyberfero s.r.l. All Rights Reserved. Sede Legale: via Statuto 3 - 42121 Reggio Emilia (RE) – PEC [email protected] Cod. fiscale e P.IVA 03058120357 – R.E.A. 356650 Informativa Privacy - Certificazioni ISO


